
Area Chart
Famous for showcasing cumulative volume, revenue growth, and total market mass over continuous time periods.
Built as true native InDesign vector polygons with translucent swatch fills. Typography stays 100% intact, automatically following your active document Paragraph and Character Styles.
Renders on your canvas in 3–4 seconds.
No matter how much data and configuration you need.
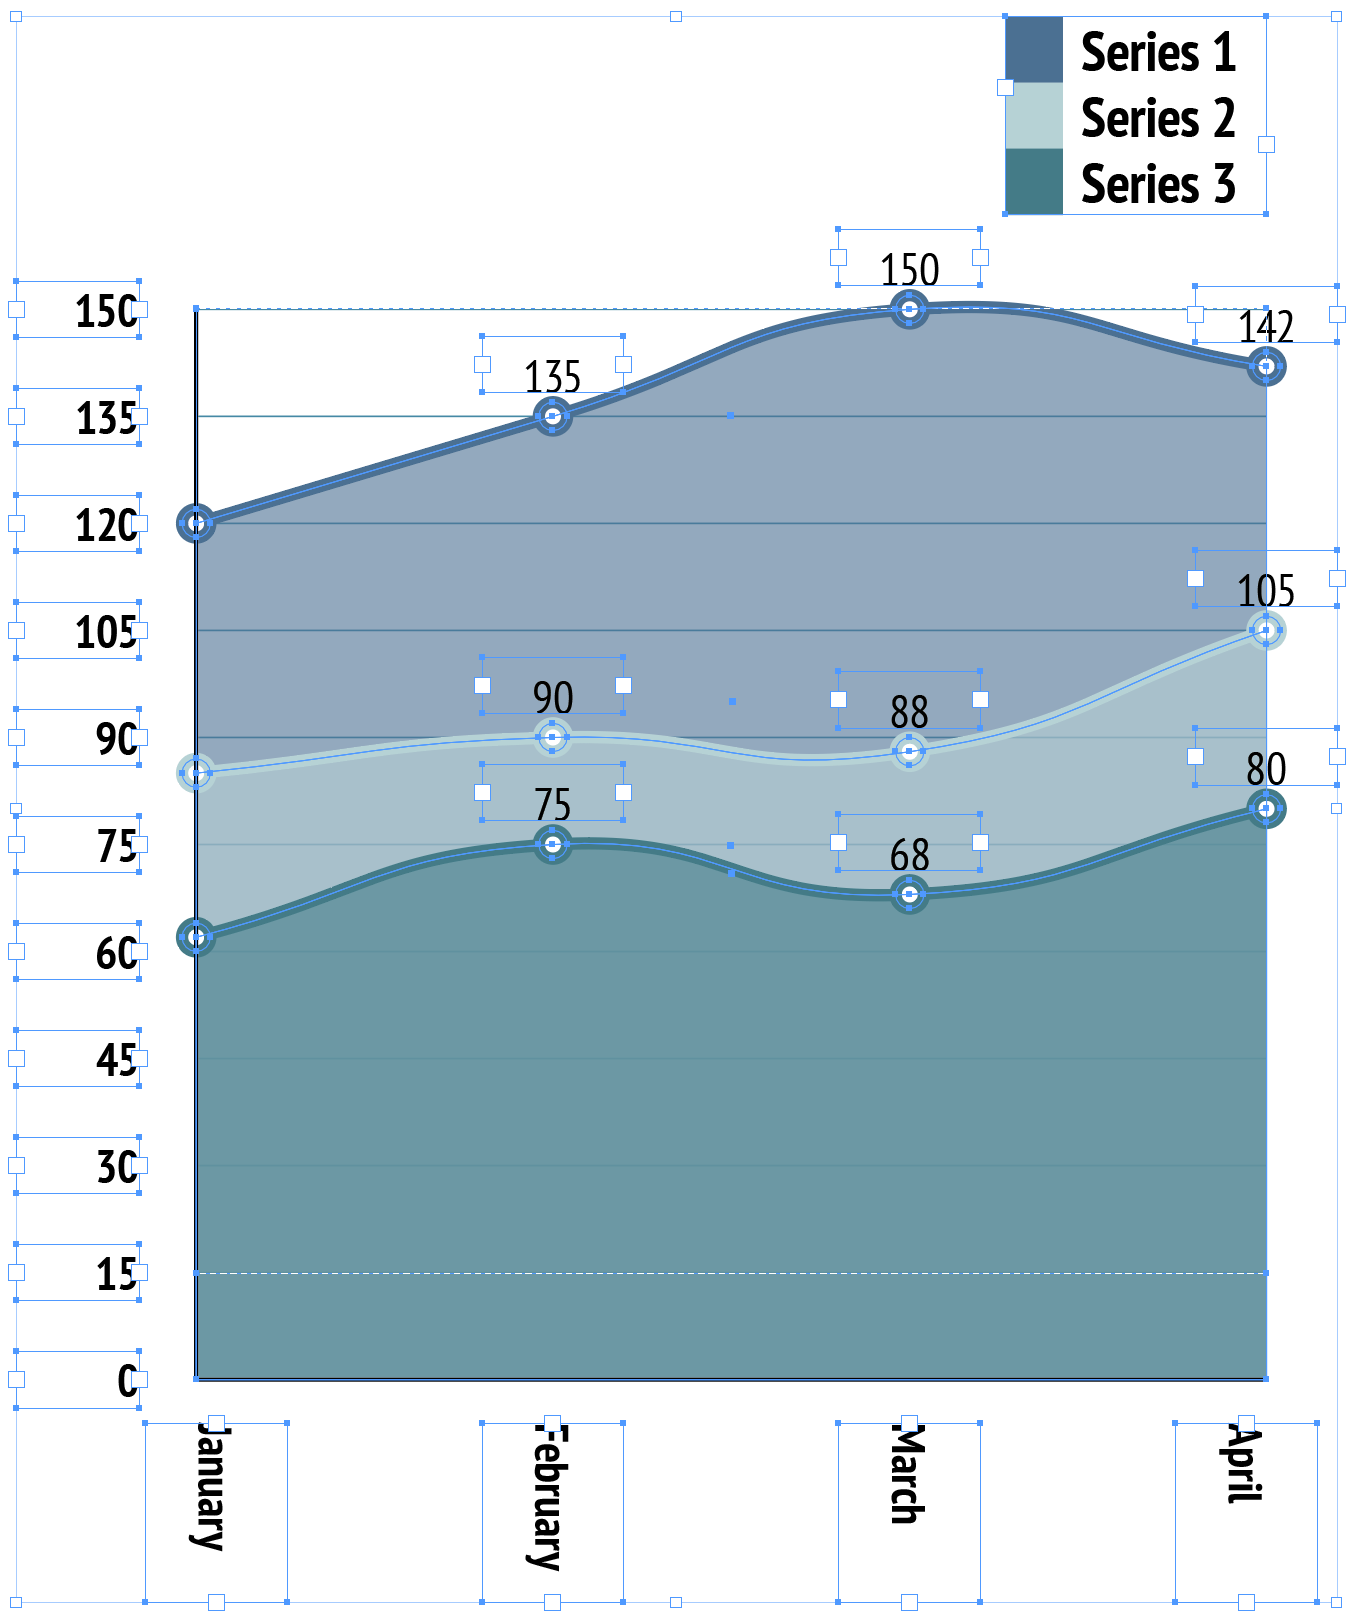
Native InDesign vector polygon selection with active handles & live swatch binding.
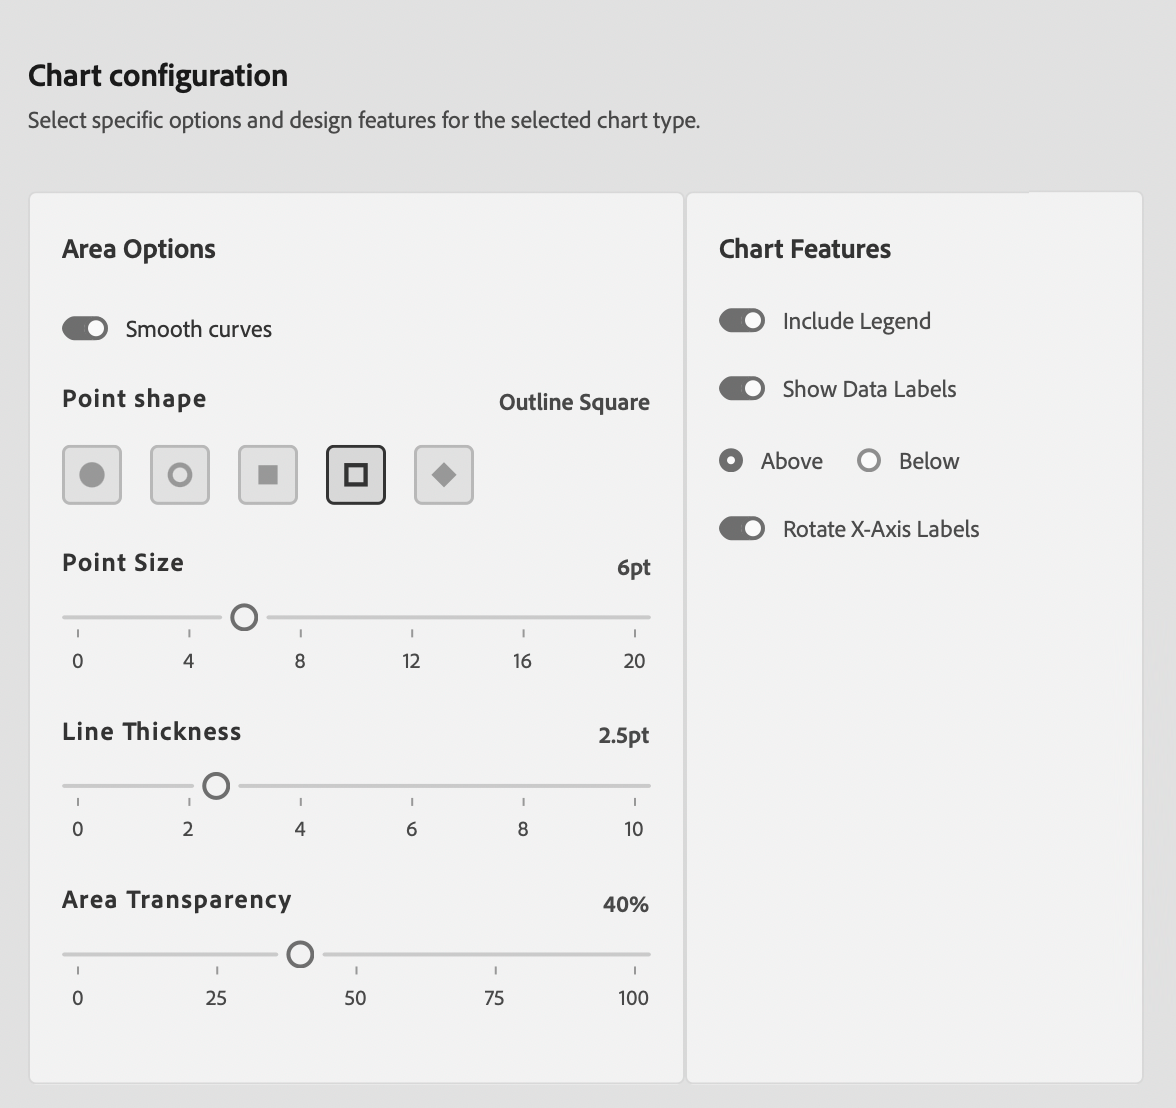
Area Chart Editorial & Usage Rules
Cumulative Volume & Mass Trends
Emphasizes aggregate volume over time intervals. Filling beneath trend lines conveys total mass (revenue, traffic, energy) much stronger than a line alone.
Avoid Heavy Series Intersections
Do not use un-stacked area charts when multiple series crisscross and occlude one another. Use Line Charts or Stacked Area Charts instead.
Publication Best Practices
- Opacity Layering: Set fill swatches to 35%–50% opacity for gridline visibility.
- Top Boundary Stroke: Pair translucent polygons with a solid 2pt top vector stroke.
- Zero Baseline: Keep baseline strictly anchored at zero for honest volumetric scale.
Sample Data Table Structure
Column 1 supplies sequential X-axis labels. Columns 2+ supply numeric series values rendered as filled vector area polygons.
| Year | Direct Sales | Agency Channel |
|---|---|---|
| 2023 | 120 | 80 |
| 2024 | 180 | 130 |
| 2025 | 260 | 210 |
| 2026 | 340 | 290 |