
Vertical Bar Chart
Famous for comparing discrete numerical values across time quarters, categories, and performance metrics.
Built as true native InDesign vector rectangles with solid swatch fills. Typography stays 100% intact, automatically following your active document Paragraph and Character Styles.
Renders on your canvas in 3–4 seconds.
No matter how much data and configuration you need.
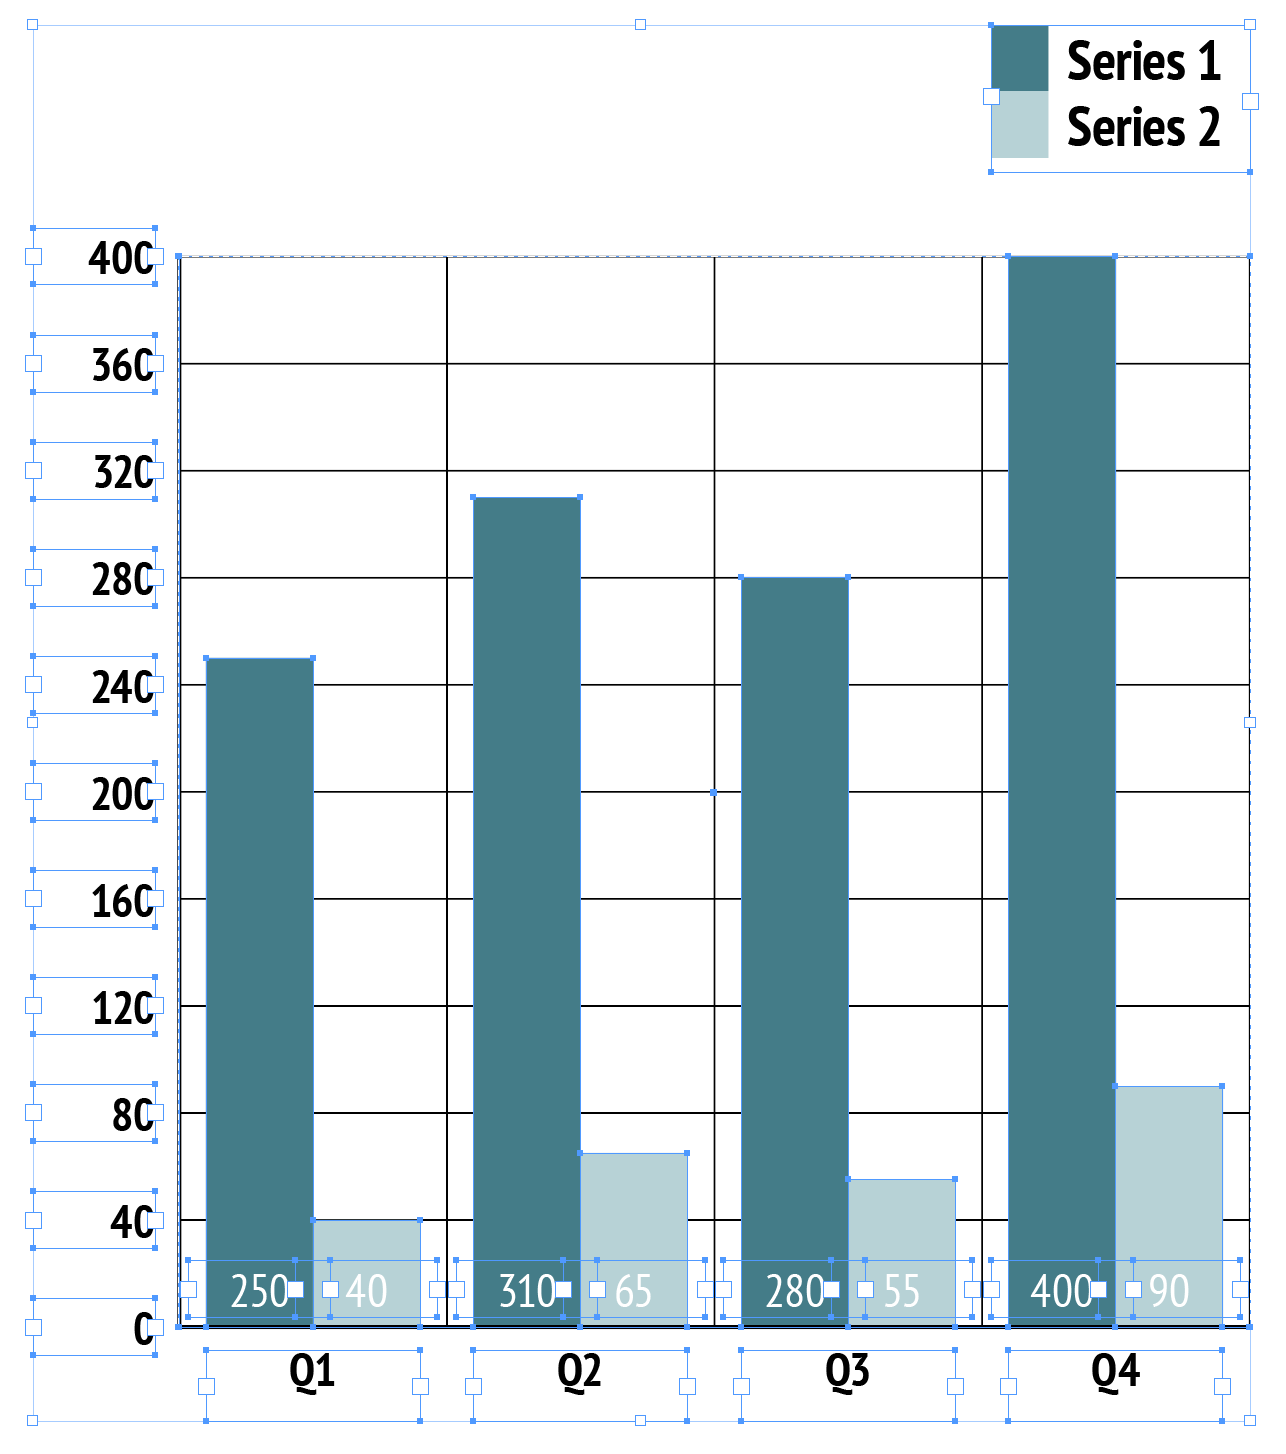
Native InDesign vector polygon selection with active handles & live swatch binding.
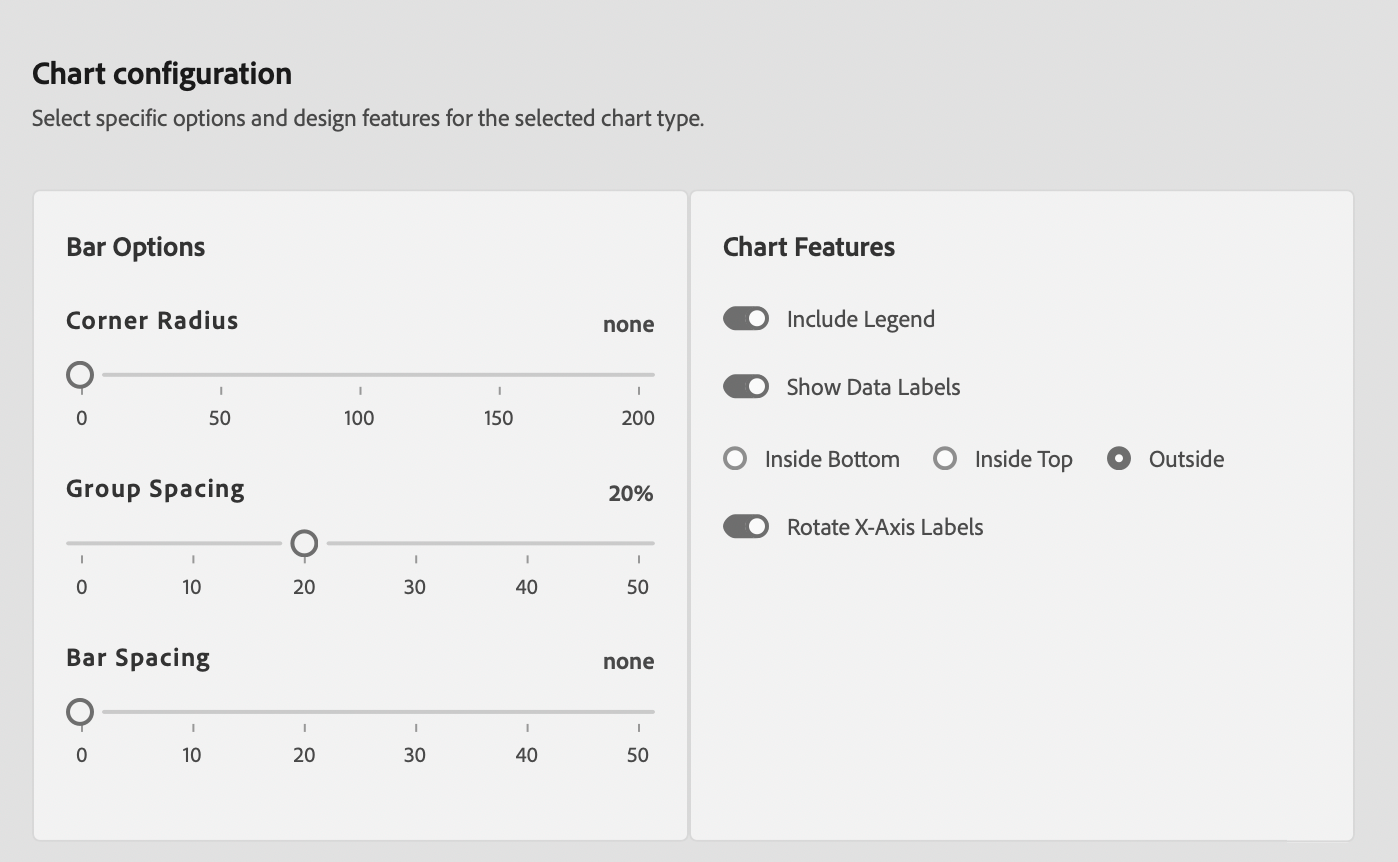
Vertical Bar Chart Editorial & Usage Rules
Comparing Discrete Categories
Vertical bar charts excel at comparing discrete numerical values across 4 to 8 distinct categories (e.g. annual financial quarters, regional sales totals). Viewers decode bar height along a shared baseline effortlessly.
Avoid Long Labels & High Cardinality
Do not use vertical bar charts if category names are long sentences (use Horizontal Bar instead) or for continuous time-series datasets with hundreds of points (use Line or Area charts).
Publication Best Practices
- Zero Baseline Invariant: Always anchor the Y-axis baseline at zero ($Y=0$) to prevent perceptual volume distortion.
- Bar Gap Math: Keep inter-bar gaps between 30% and 50% of bar width for optical balance.
- Category Typography: Use Character Style tracking on dense category labels; apply 45° or 90° rotation if labels exceed 8 characters.
Sample Data Table Structure
Column 1 supplies category labels. Columns 2+ represent numeric values for single or grouped vertical bars.
| Quarter | Revenue ($M) | Operating Profit ($M) |
|---|---|---|
| Q1 2026 | 45.2 | 12.8 |
| Q2 2026 | 68.4 | 21.5 |
| Q3 2026 | 85.0 | 34.1 |
| Q4 2026 | 94.6 | 42.0 |