
Radar Chart
Famous for multi-variable skill evaluation, product scoring profiles, and multivariate performance balance.
Built as true native InDesign polar polygons with translucent fill swatches. Typography stays 100% intact, automatically following your active document Paragraph and Character Styles.
Renders on your canvas in 3–4 seconds.
No matter how much data and configuration you need.
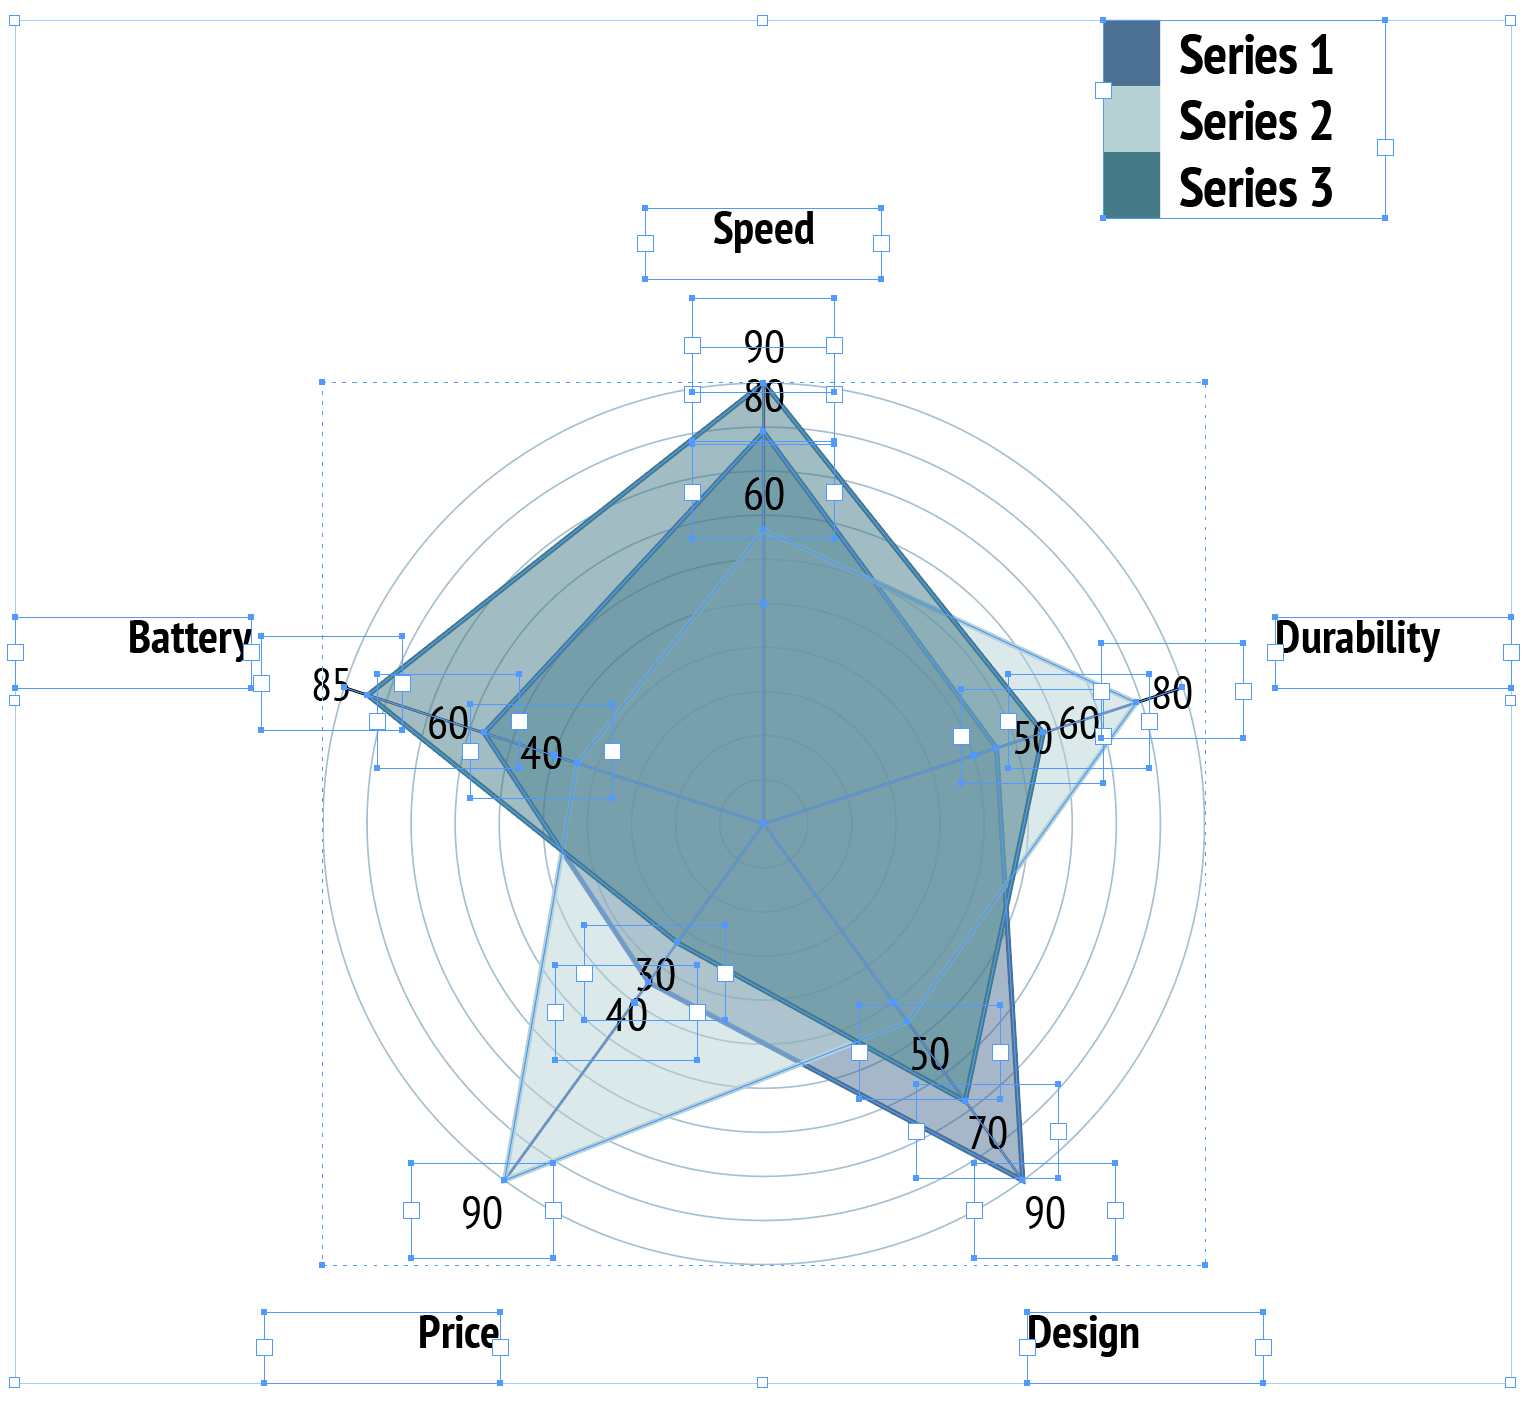
Native InDesign vector polygon selection with active handles & live swatch binding.
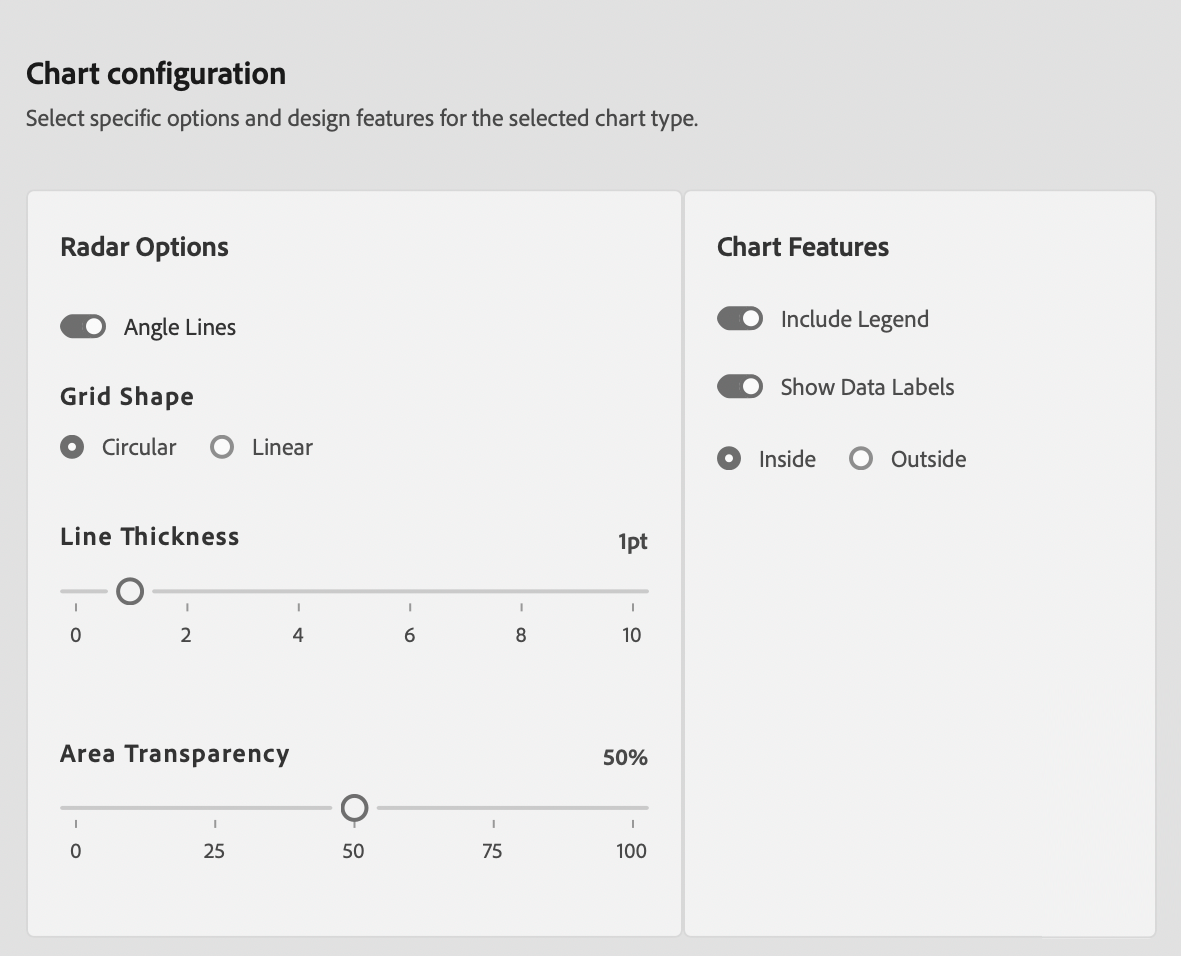
Radar Chart Editorial & Usage Rules
Multivariate Performance Profiles
Best for comparing 5 to 8 standardized metrics simultaneously across 2 or 3 entities (e.g., candidate competencies or product specs).
Avoid Un-normalized Metrics
Do not combine variables with different units or scales (e.g., $ revenue with age) on the same polar axis set.
Publication Best Practices
- Spoke Count Limit: Keep radar spokes between 5 and 8 items for optimal geometric legibility.
- Translucent Swatches: Use 30%–40% fill opacity so underlying polygons remain visible.
- Label Clearance: Ensure outer attribute text frames have generous padding around polar vertices.
Sample Data Table Structure
Column 1 lists attributes/competencies. Columns 2+ represent scores for entity comparison.
| Competency | Product A | Product B |
|---|---|---|
| Usability | 85 | 90 |
| Speed | 92 | 78 |
| Security | 95 | 88 |
| Flexibility | 70 | 85 |
| Support | 88 | 92 |