
Stacked Bar Chart
Famous for illustrating total category volume alongside component breakdown shares.
Built as true native InDesign stacked vector frames with distinct swatch color assignments. Typography stays 100% intact, automatically following your active document Paragraph and Character Styles.
Renders on your canvas in 3–4 seconds.
No matter how much data and configuration you need.
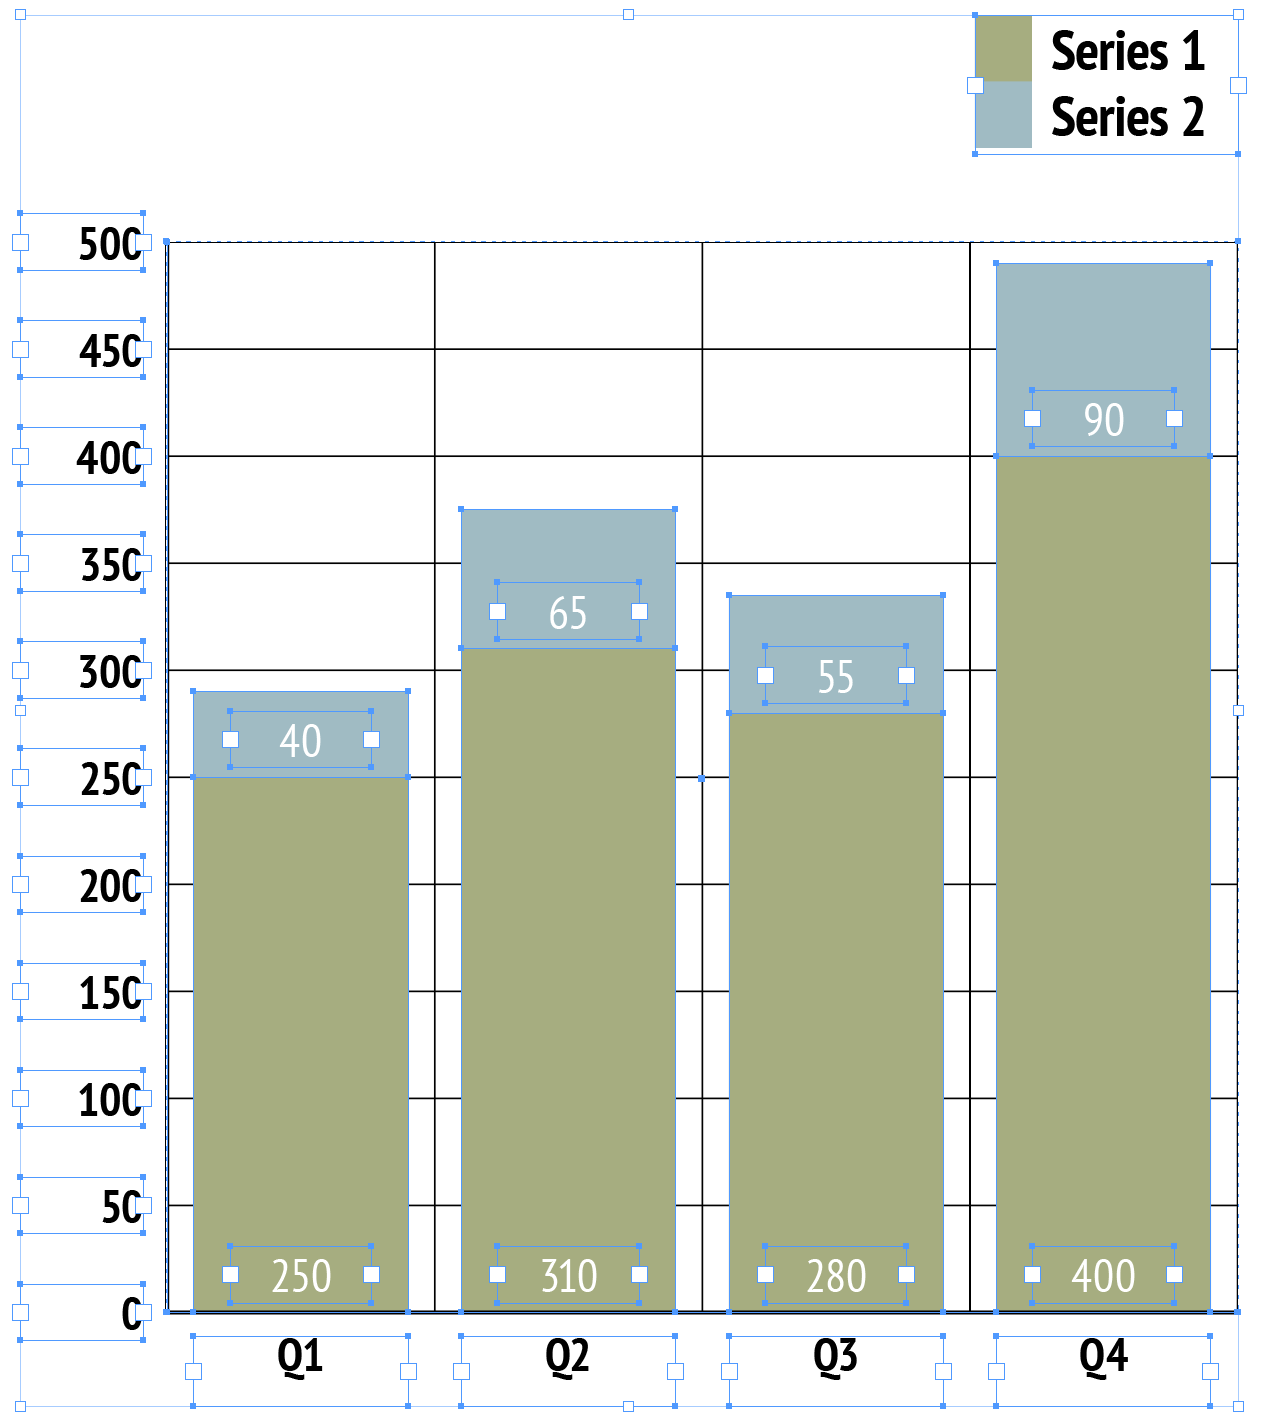
Native InDesign vector polygon selection with active handles & live swatch binding.
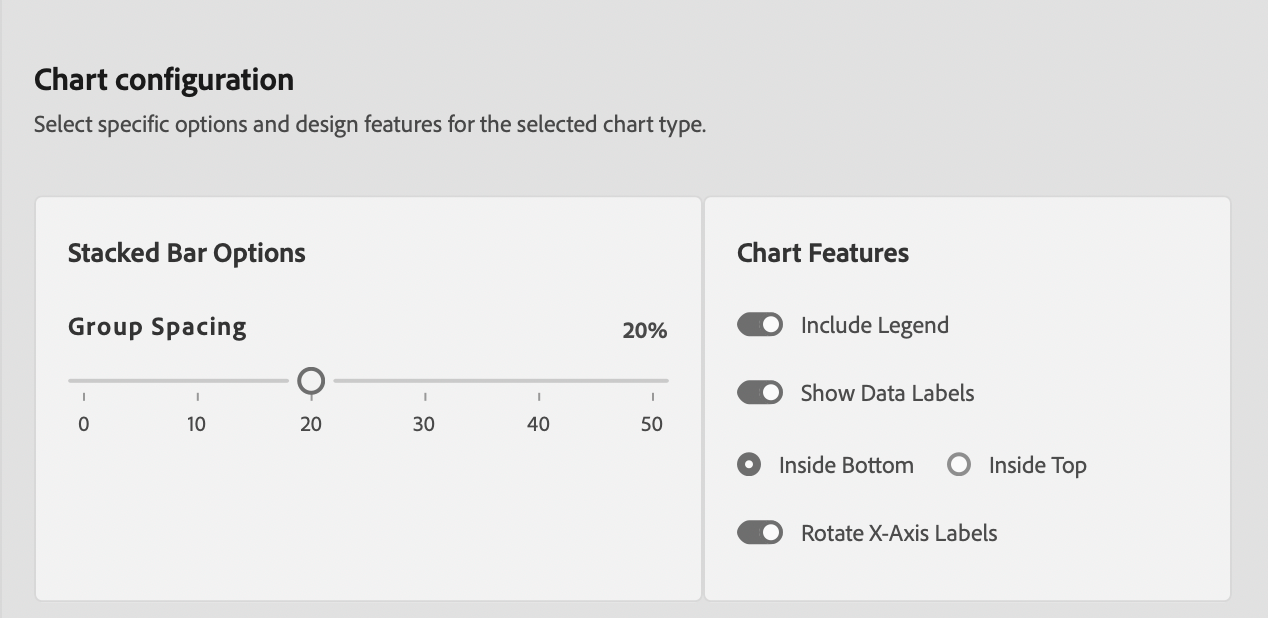
Stacked Bar Chart Editorial & Usage Rules
Part-to-Whole & Total Mass
Ideal for demonstrating both aggregate group size and component sub-totals simultaneously across discrete categories.
Avoid Too Many Sub-Segments
Limit stacked segments to 3–5 categories maximum per bar. Too many segments make internal segment comparisons baseline-shifted and difficult to evaluate.
Publication Best Practices
- Baseline Stability: Place the most important or least variable segment at the bottom baseline so it shares a consistent zero axis.
- Swatch Contrast: Use distinct swatch fills to ensure individual segment boundaries stand out.
- Segment Labels: Suppress data labels on tiny sub-segments to prevent typographical overlap.
Sample Data Table Structure
Column 1 supplies category columns. Columns 2+ define stacked series components.
| Department | Hardware ($K) | Software ($K) | Services ($K) |
|---|---|---|---|
| Q1 | 120 | 85 | 45 |
| Q2 | 140 | 95 | 60 |
| Q3 | 165 | 110 | 75 |
| Q4 | 190 | 130 | 90 |