
Treemap
Famous for hierarchical area partitioning, portfolio market share, and budget allocations.
Built as true native InDesign rectangular tile polygons with proportional area sizing. Typography stays 100% intact, automatically following your active document Paragraph and Character Styles.
Renders on your canvas in 3–4 seconds.
No matter how much data and configuration you need.
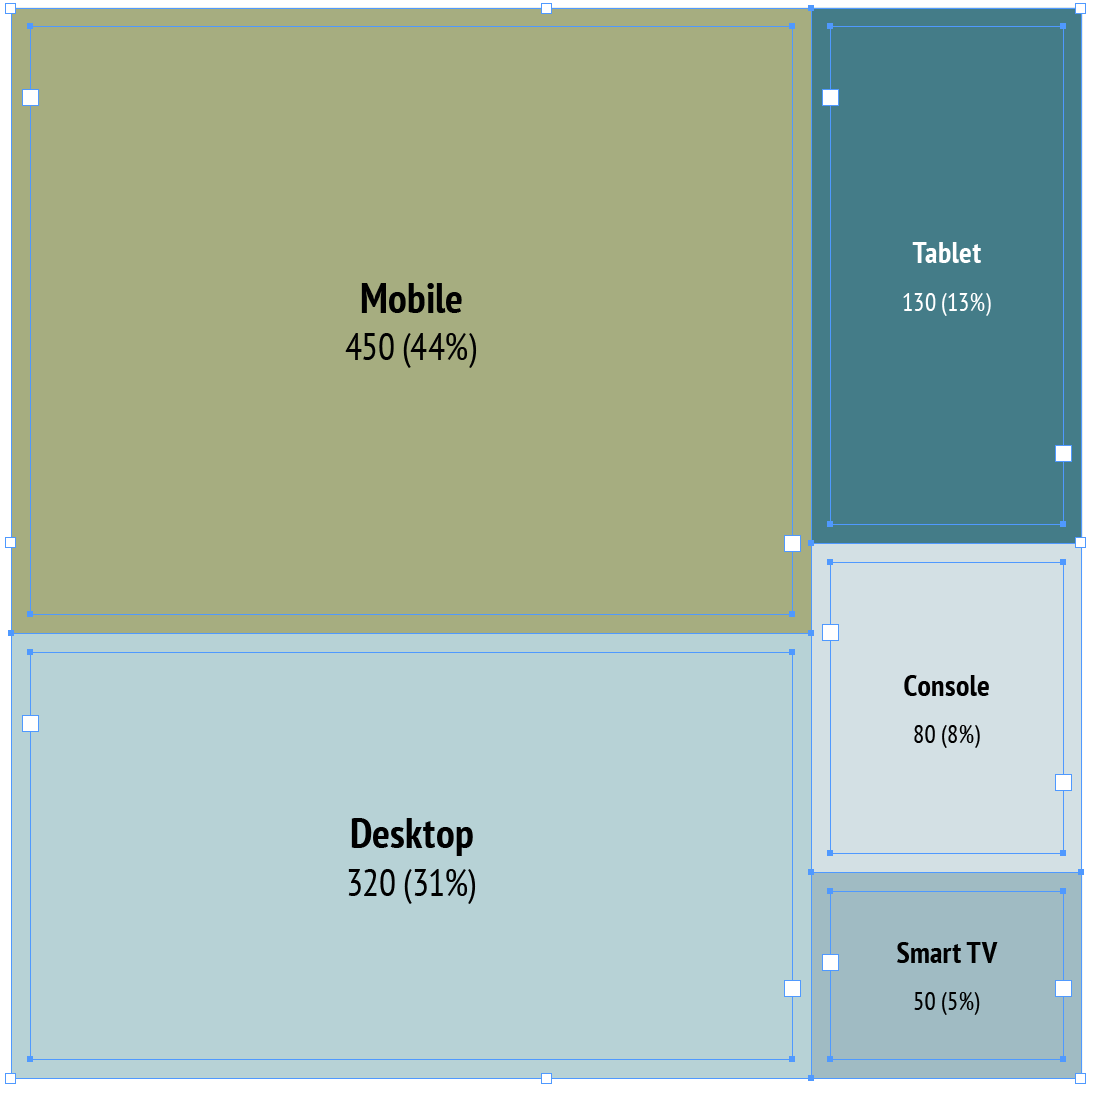
Native InDesign vector polygon selection with active handles & live swatch binding.
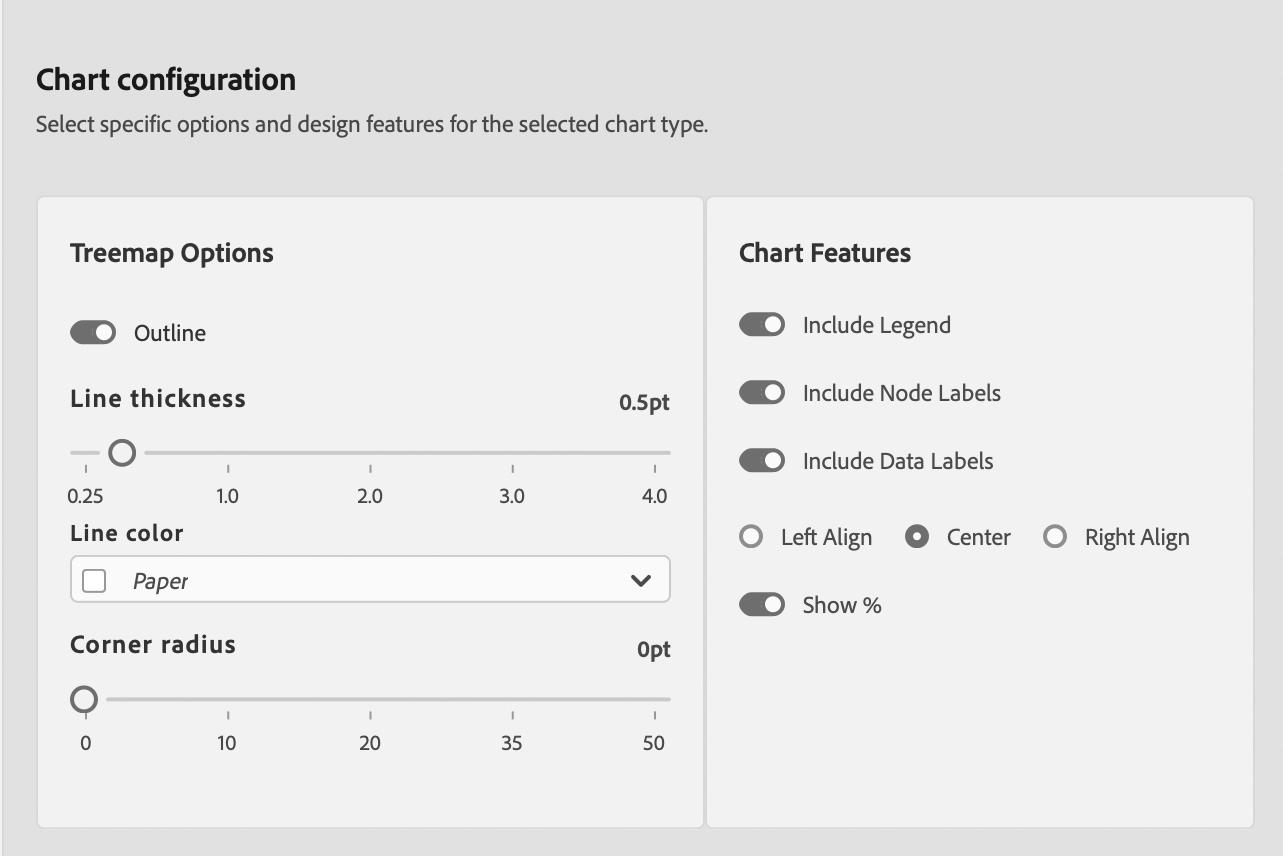
Treemap Editorial & Usage Rules
Hierarchical Data & Proportions
Exceptional for displaying complex multi-category portfolios, market caps, or budget breakdowns where area represents total mass.
Avoid Fine Quantity Differences
Do not use treemaps when readers need to discern precise minor numerical differences between similar-sized tiles.
Publication Best Practices
- Tile Padding: Apply distinct stroke gaps between tiles so borders remain clean and legible on printed pages.
- Typography Clipping: Enable text frame auto-fit so tile text never overflows smaller rectangles.
- Color Hierarchy: Use color intensity to represent secondary variables like performance growth.
Sample Data Table Structure
Column 1 defines category sectors. Column 2 supplies numerical magnitude for area partitioning.
| Asset Sector | Allocation ($M) |
|---|---|
| Technology | 450 |
| Healthcare | 280 |
| Financials | 210 |
| Consumer | 140 |
| Energy | 90 |