
Radial Bar Chart
Famous for circular progress indicators, target goal completion, and multi-category metrics.
Built as true native InDesign concentric vector ring arcs with background track fills. Typography stays 100% intact, automatically following your active document Paragraph and Character Styles.
Renders on your canvas in 3–4 seconds.
No matter how much data and configuration you need.
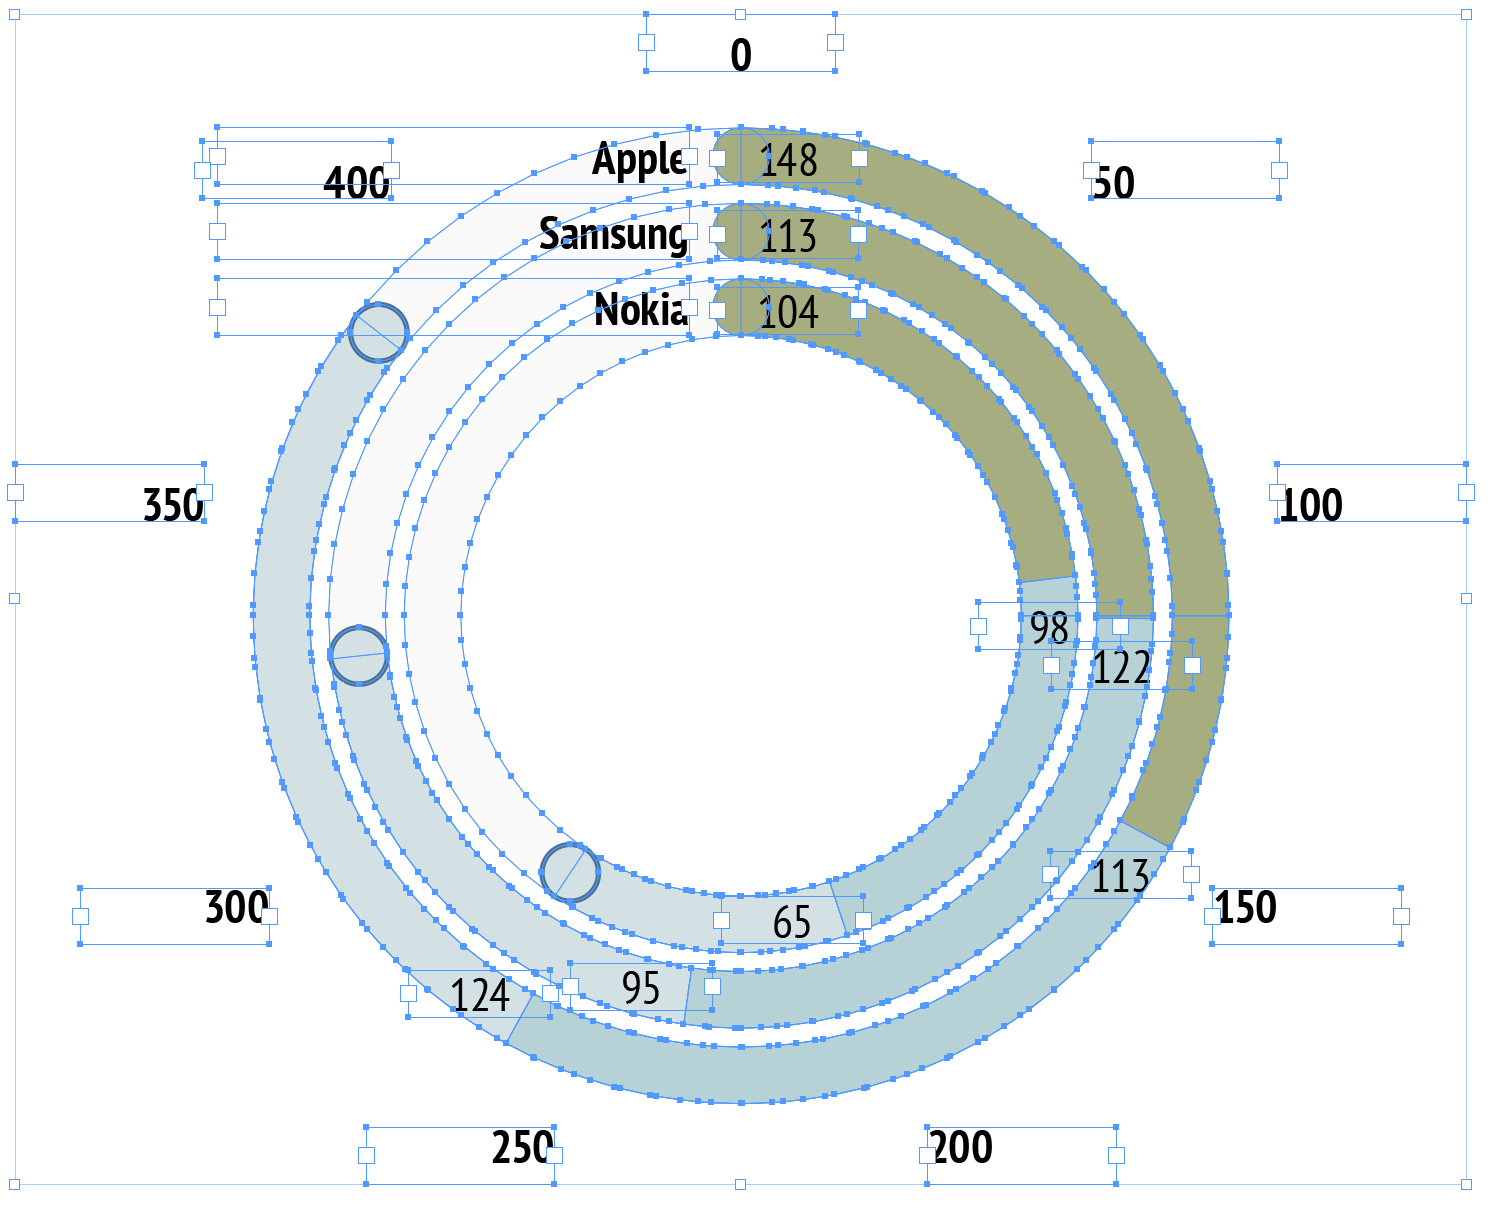
Native InDesign vector polygon selection with active handles & live swatch binding.
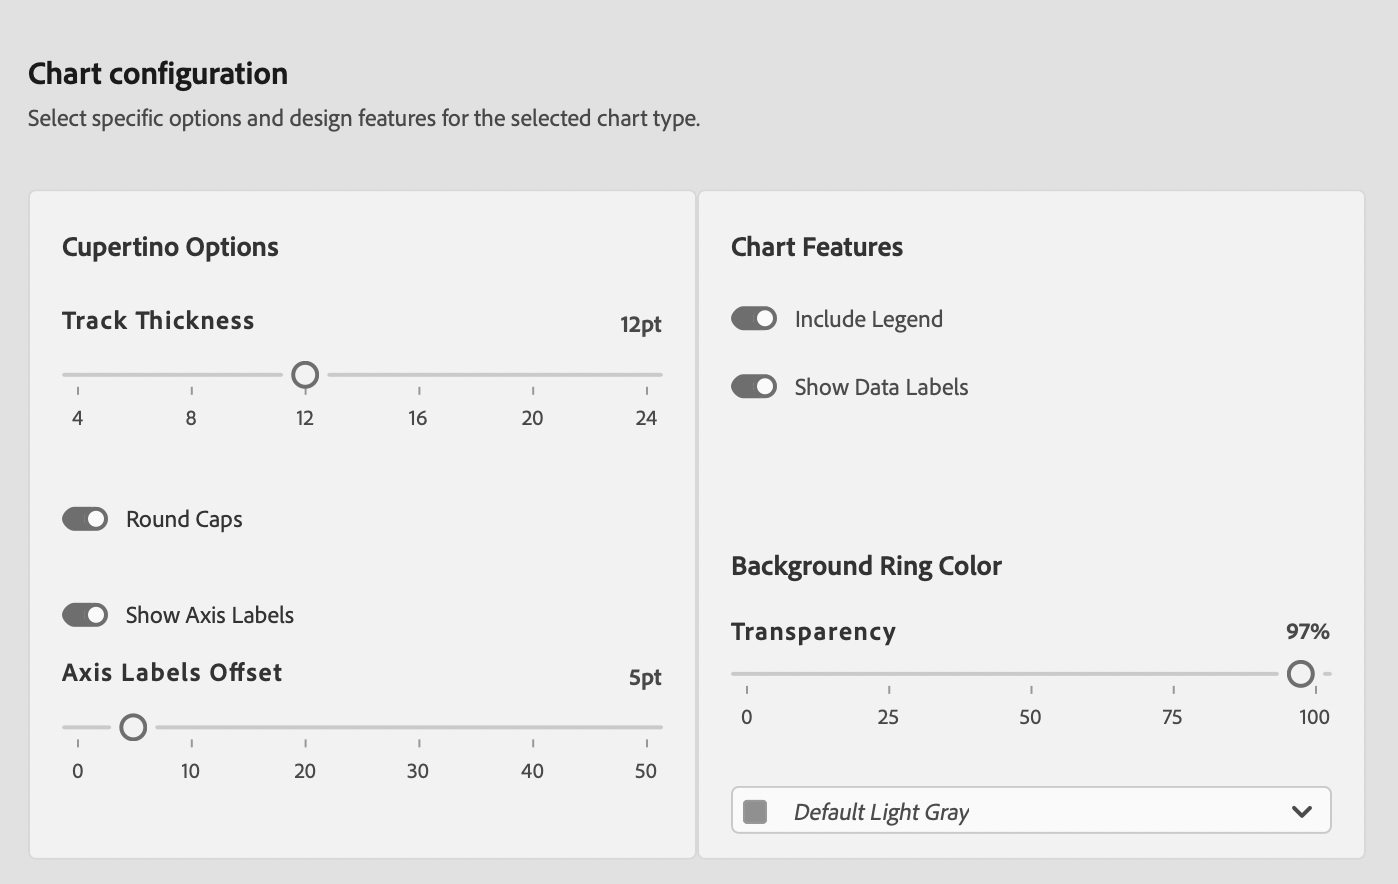
Radial Bar Chart Editorial & Usage Rules
Progress Tracking & Goals
Ideal for dashboard infometrics, target achievement percentages, and striking circular visual reporting.
Avoid Precise Radial Comparisons
Do not rely on radial bar charts for precise length comparisons between inner and outer arcs, as outer arcs have larger perimeter circumferences.
Publication Best Practices
- Explicit Labels: Always display numerical percentage values next to each track so readers don't misjudge length due to radius scaling.
- Track Contrast: Use soft 10%–15% background track fills to anchor the full 100% path circumference.
- Concentric Gaps: Keep gap spacing consistent across all radial rings.
Sample Data Table Structure
Column 1 lists goals/metrics. Column 2 contains percentage completion figures.
| Goal Metric | Completion (%) |
|---|---|
| User Growth | 88 |
| Revenue Goal | 74 |
| Customer Retention | 92 |
| CSAT Score | 65 |