
Doughnut Chart
Famous for part-to-whole proportions with a clean center hole for summary totals and KPI callouts.
Built as true 4-sided annular vector sectors with 100% transparent vector hole geometry. Typography stays 100% intact, automatically following your active document Paragraph and Character Styles.
Renders on your canvas in 3–4 seconds.
No matter how much data and configuration you need.
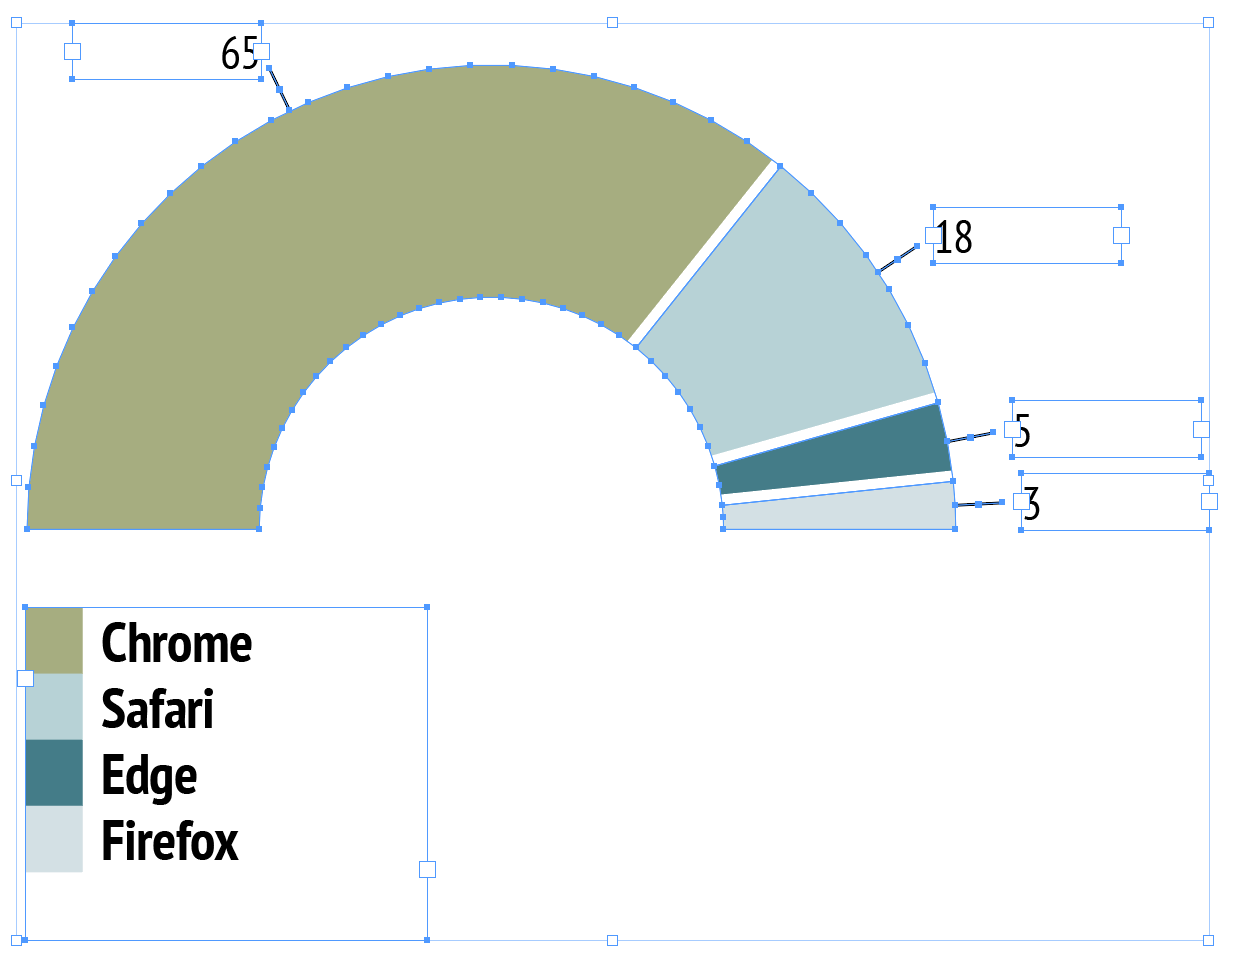
Native InDesign vector polygon selection with active handles & live swatch binding.
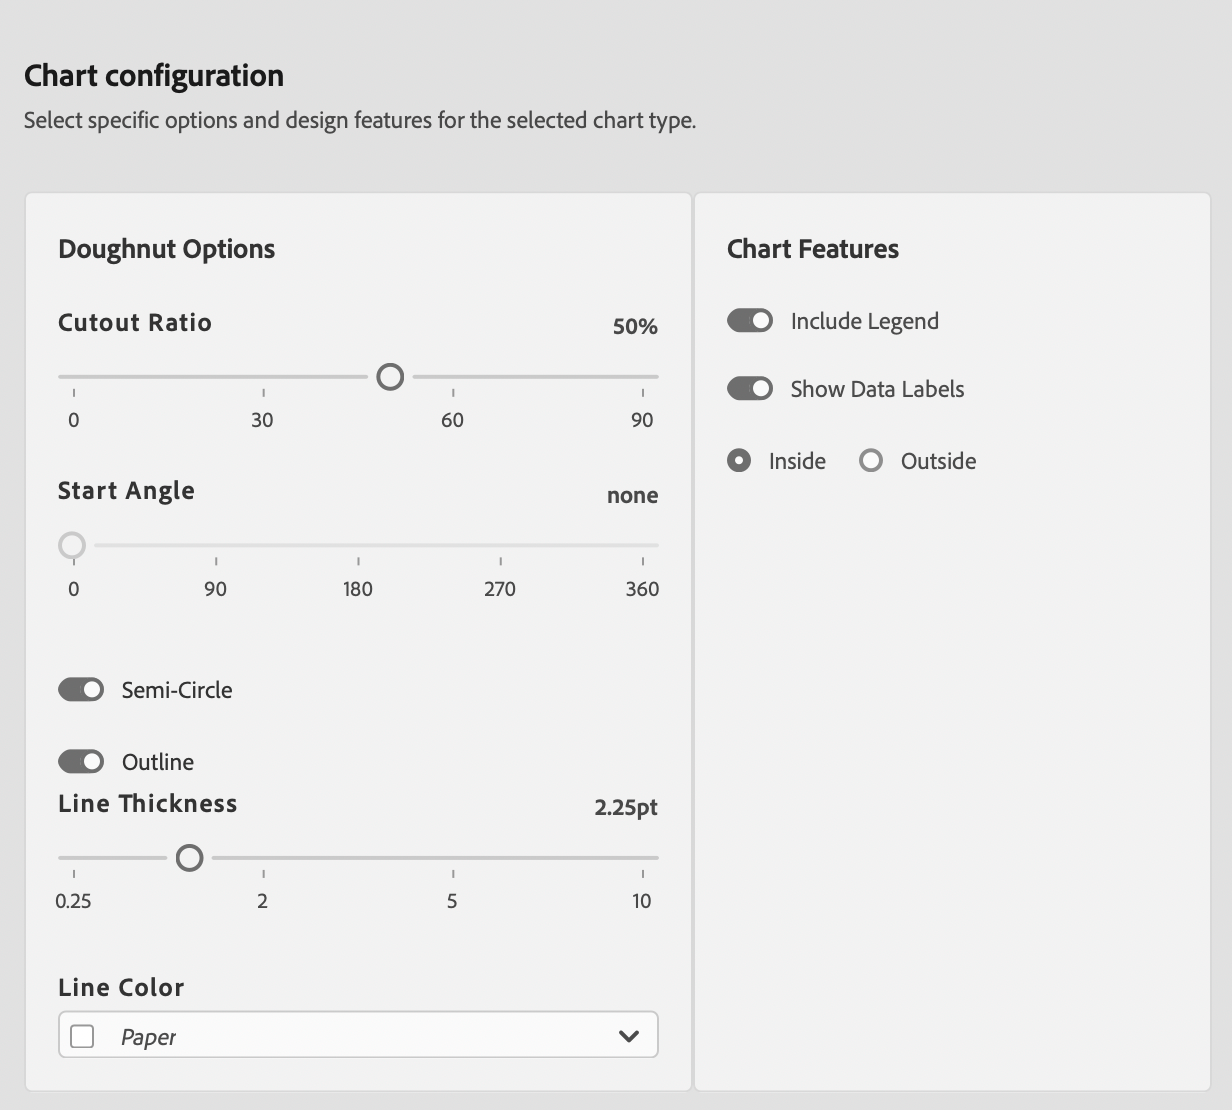
Doughnut Chart Editorial & Usage Rules
KPI Summary & Modern Proportions
Excellent for modern magazine layouts where center space holds an impactful summary figure ($1.2M Total) alongside category shares.
Avoid Micro Slices
Do not include more than 5 slices. Avoid tiny sub-2% slices that crowd the annular ring.
Publication Best Practices
- Center Hole Transparency: Ensure center hole geometry is 100% vector transparent so background page colors pass through.
- KPI Callout Contrast: Use bold document Paragraph Styles for center summary numbers.
- Annular Thickness: Keep ring thickness between 30% and 50% of radius for balanced proportions.
Sample Data Table Structure
Column 1 lists categories. Column 2 contains numeric shares for doughnut ring rendering.
| Category | Budget Allocation ($K) |
|---|---|
| Product R&D | 520 |
| Marketing | 310 |
| Operations | 240 |
| Sales & Admin | 130 |