
Horizontal Stacked Bar Chart
Famous for survey demographic breakdowns, Likert scale responses, and long-label component comparisons.
Built as true native InDesign stacked horizontal bars with distinct swatch fills. Typography stays 100% intact, automatically following your active document Paragraph and Character Styles.
Renders on your canvas in 3–4 seconds.
No matter how much data and configuration you need.
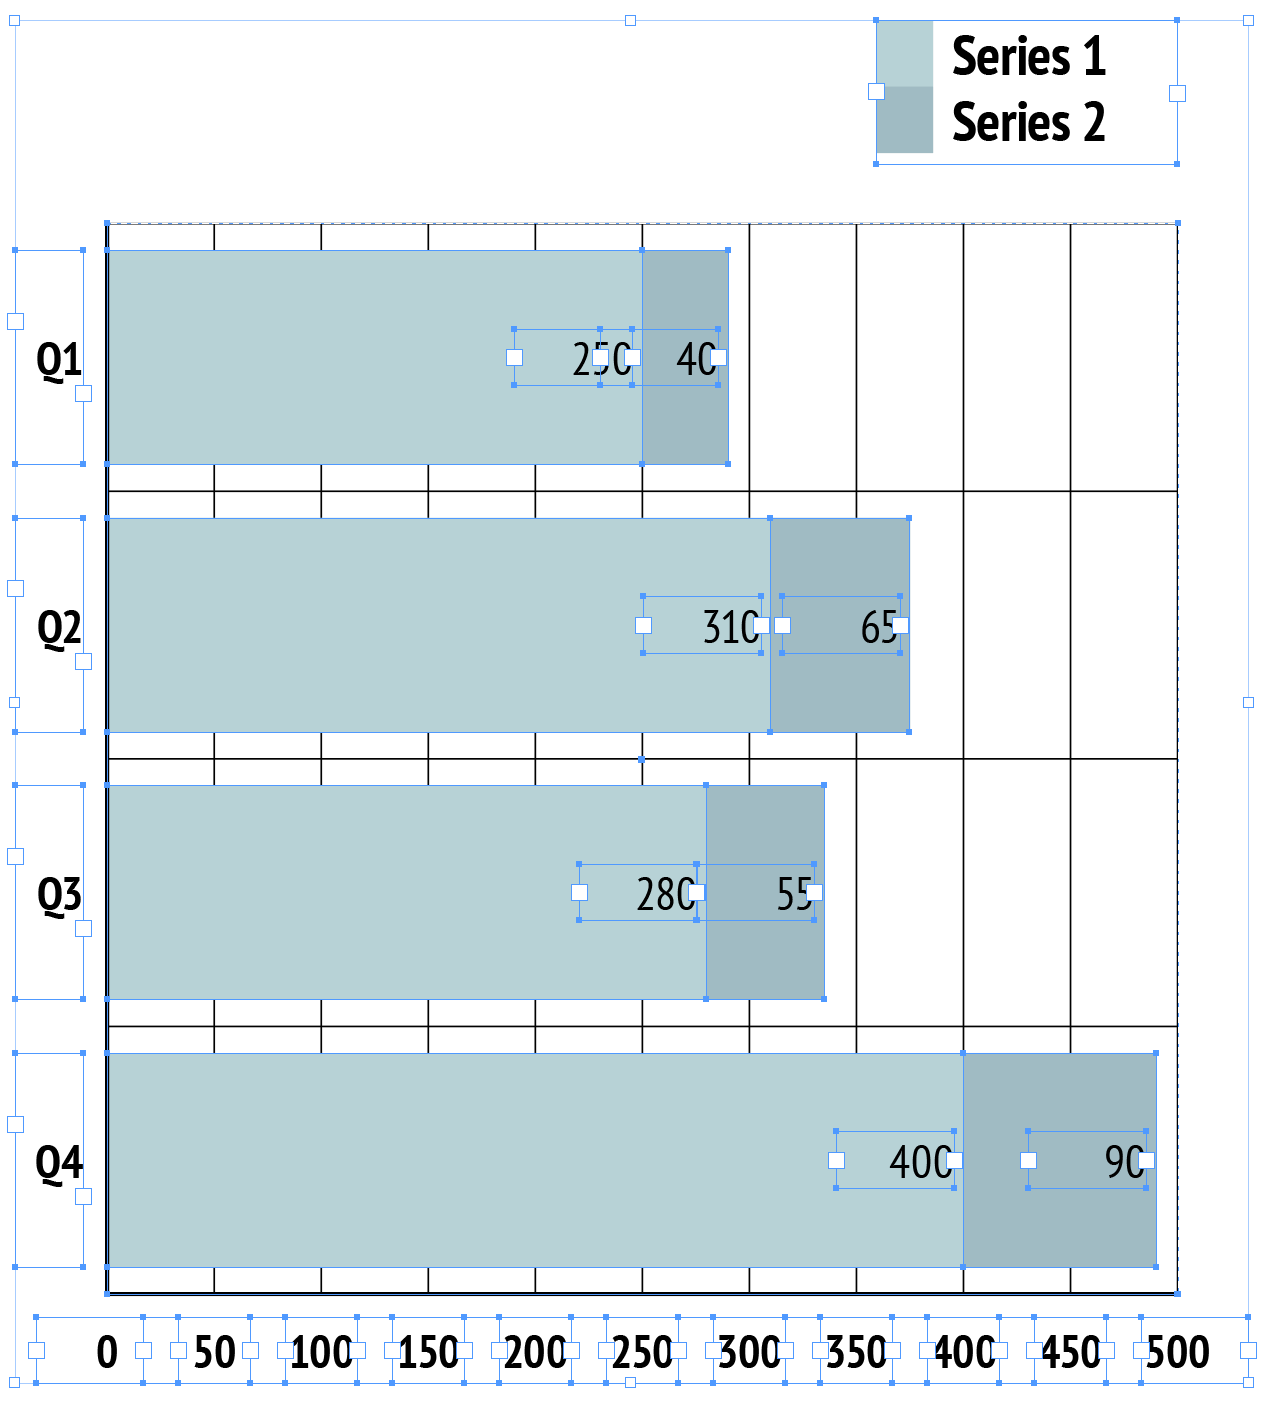
Native InDesign vector polygon selection with active handles & live swatch binding.
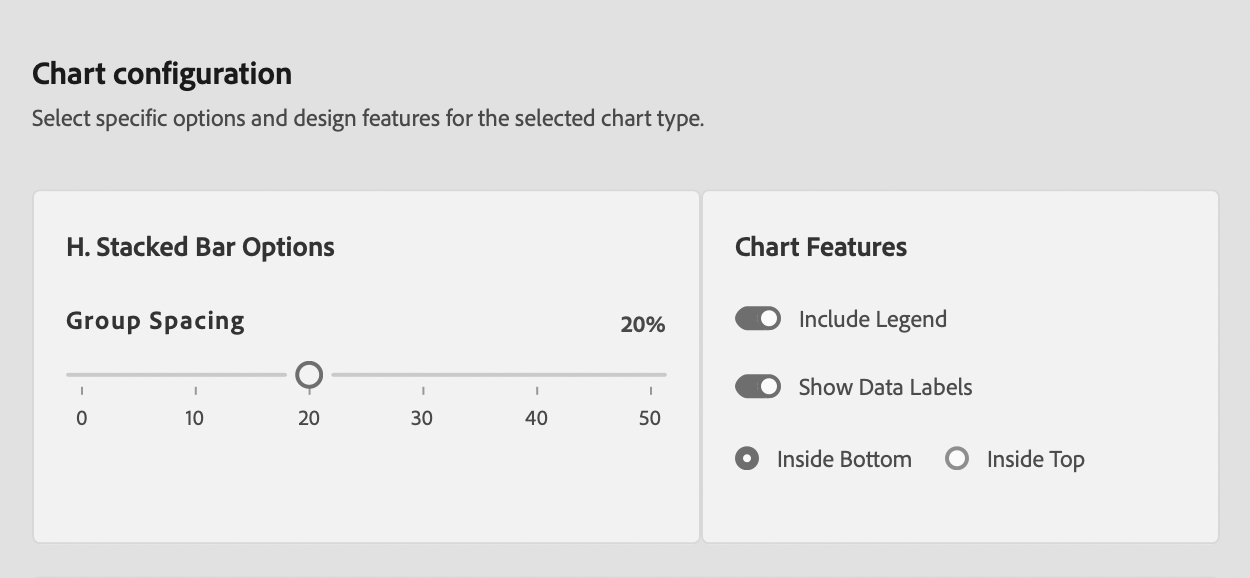
Horizontal Stacked Bar Editorial & Usage Rules
Demographic & Survey Composition
Best choice for survey results (Agree/Neutral/Disagree) and categorical breakdowns where category titles require full horizontal sentences.
Avoid Rapid Sub-Segment Jumps
Avoid using stacked horizontal bars when precise comparison between middle segments across rows is critical, as middle segments lack a common baseline.
Publication Best Practices
- Color Palette: Use contrasting swatches with clear brightness variation so segment boundaries remain distinct when printed in monochrome.
- Total Labels: Append row totals to the outer right edge for total volume clarity.
- Text Readability: Ensure white text labels on dark swatches meet contrast standards.
Sample Data Table Structure
Column 1 supplies survey or category rows. Columns 2+ define component series.
| Demographic | Satisfied | Neutral | Dissatisfied |
|---|---|---|---|
| Age 18-34 | 65 | 20 | 15 |
| Age 35-54 | 58 | 25 | 17 |
| Age 55+ | 72 | 18 | 10 |