
Horizontal Bar Chart
Famous for ranking survey results, leaderboard metrics, and categories with long text labels.
Built as true native InDesign horizontal vector bars with solid swatch fills. Typography stays 100% intact, automatically following your active document Paragraph and Character Styles.
Renders on your canvas in 3–4 seconds.
No matter how much data and configuration you need.
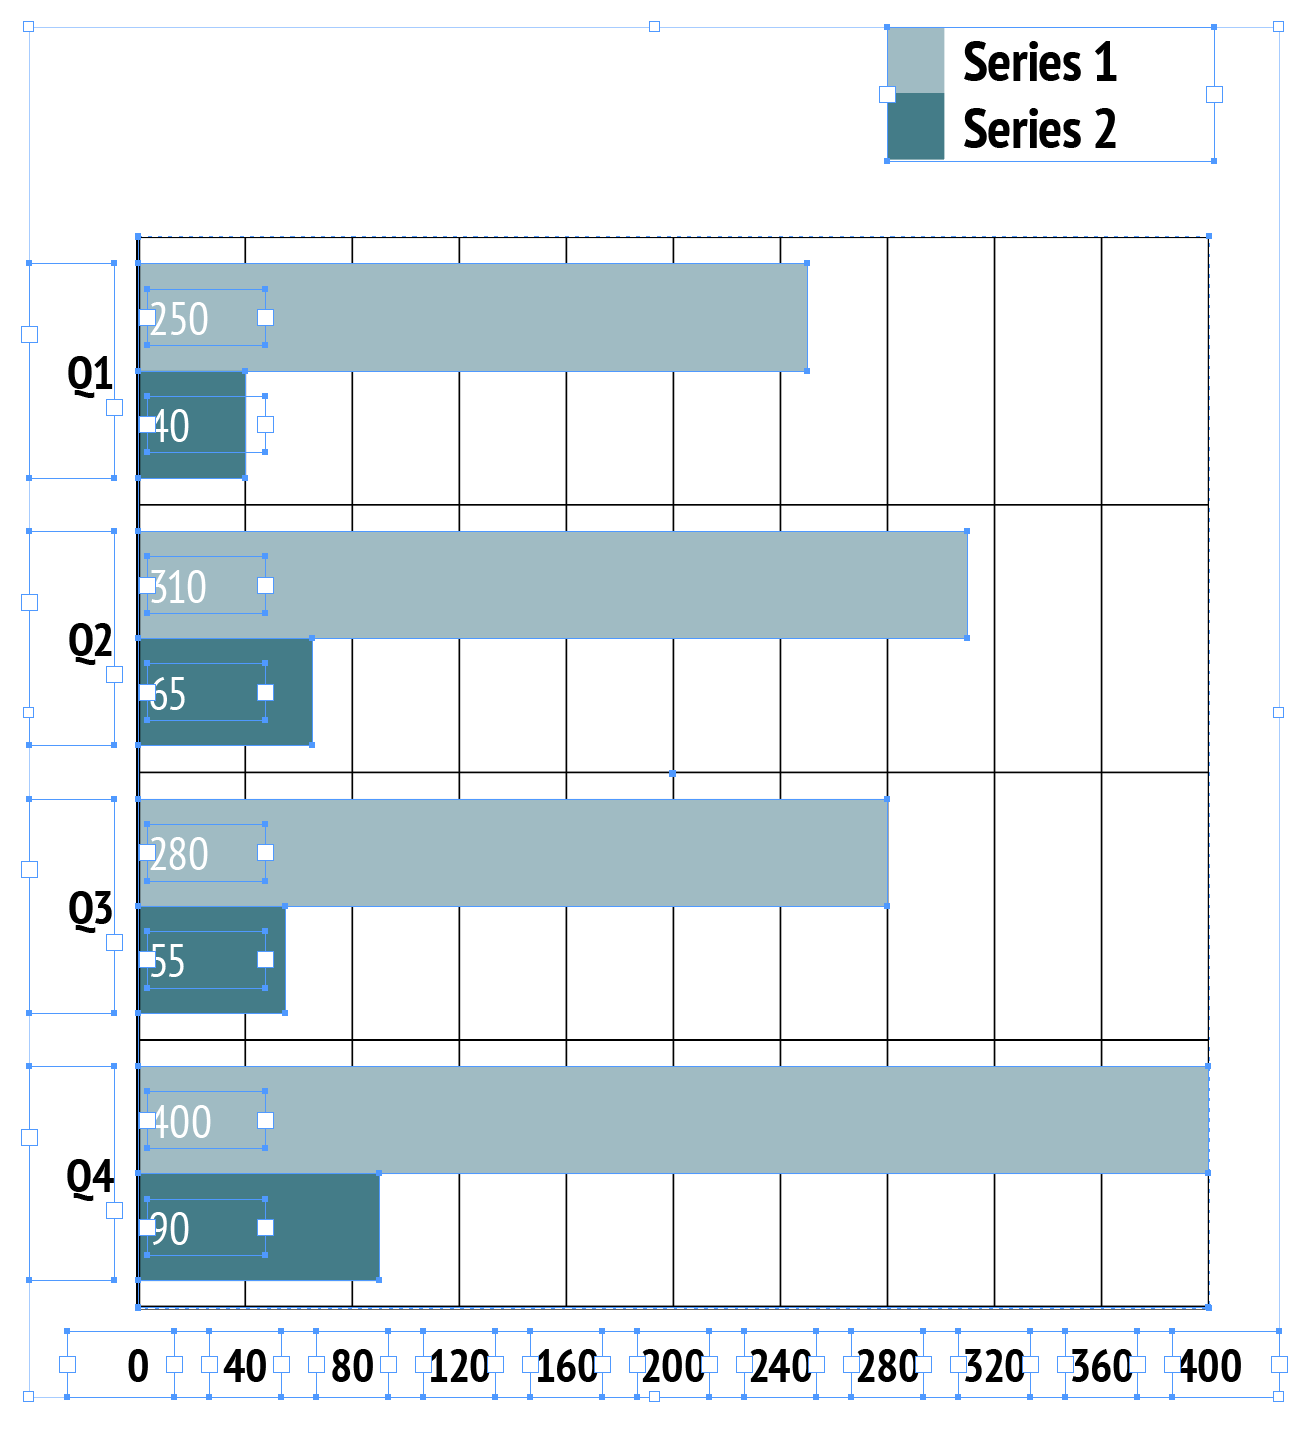
Native InDesign vector polygon selection with active handles & live swatch binding.
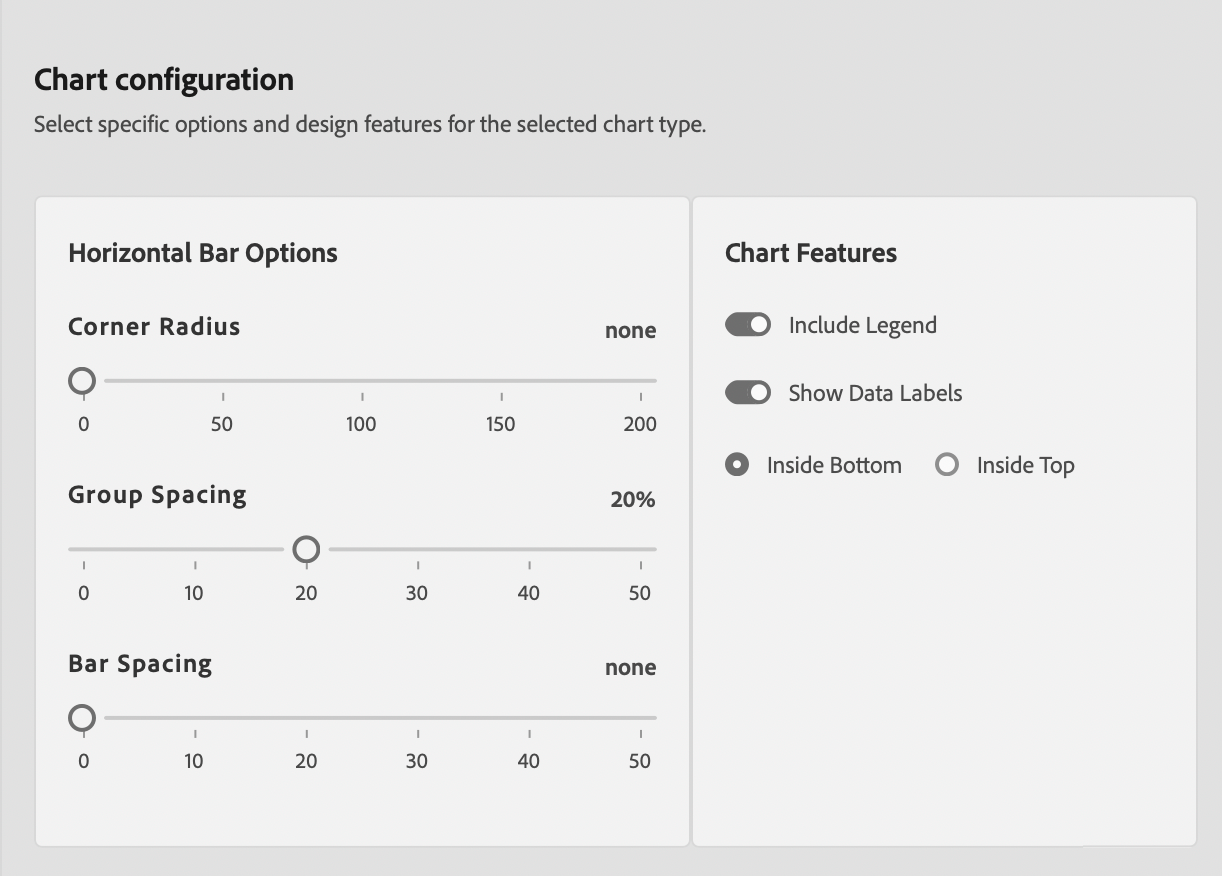
Horizontal Bar Chart Editorial & Usage Rules
Long Category Names & Rankings
Perfect for items with descriptive titles, survey responses, or country rankings. Horizontal reading flow keeps category typography completely horizontal and easy to read.
Avoid Time Series Data
Do not use horizontal bar charts for chronological time trends (e.g., months or years). Time flows horizontally left-to-right; use Vertical Bar or Line charts for time-based data.
Publication Best Practices
- Value Sorting: Sort categories logically by value magnitude (highest to lowest) rather than random order.
- Y-Axis Margins: Ensure Y-axis label text frame has generous inset padding so labels don't collide with bars.
- Zero Baseline: Always start the horizontal baseline at $X=0$ for transparent numeric comparison.
Sample Data Table Structure
Column 1 supplies horizontal category names. Columns 2+ represent numeric values.
| Region | Market Share (%) | Growth Rate (%) |
|---|---|---|
| North America | 42.5 | 12.1 |
| Europe & UK | 28.4 | 8.5 |
| Asia Pacific | 18.2 | 15.4 |
| Latin America | 10.9 | 6.2 |